


How Longitudinal Data Optimizes Patient Journeys

Key Takeaways
Longitudinal data tracks patient health over time, offering a complete view of their medical journey. Unlike single-point snapshots, it connects events like diagnoses, treatments, and medication adherence to reveal patterns that help improve care. For example, delays between referrals and appointments or gaps in medication adherence can be identified and addressed. Pharmaceutical companies and healthcare providers use this data to pinpoint where patients struggle and design interventions to reduce drop-offs, improve adherence, and enhance outcomes.
Key Takeaways:
This approach shifts healthcare from reactive to proactive, helping patients stay on track with treatments while enabling better decision-making for healthcare teams and pharmaceutical leaders.
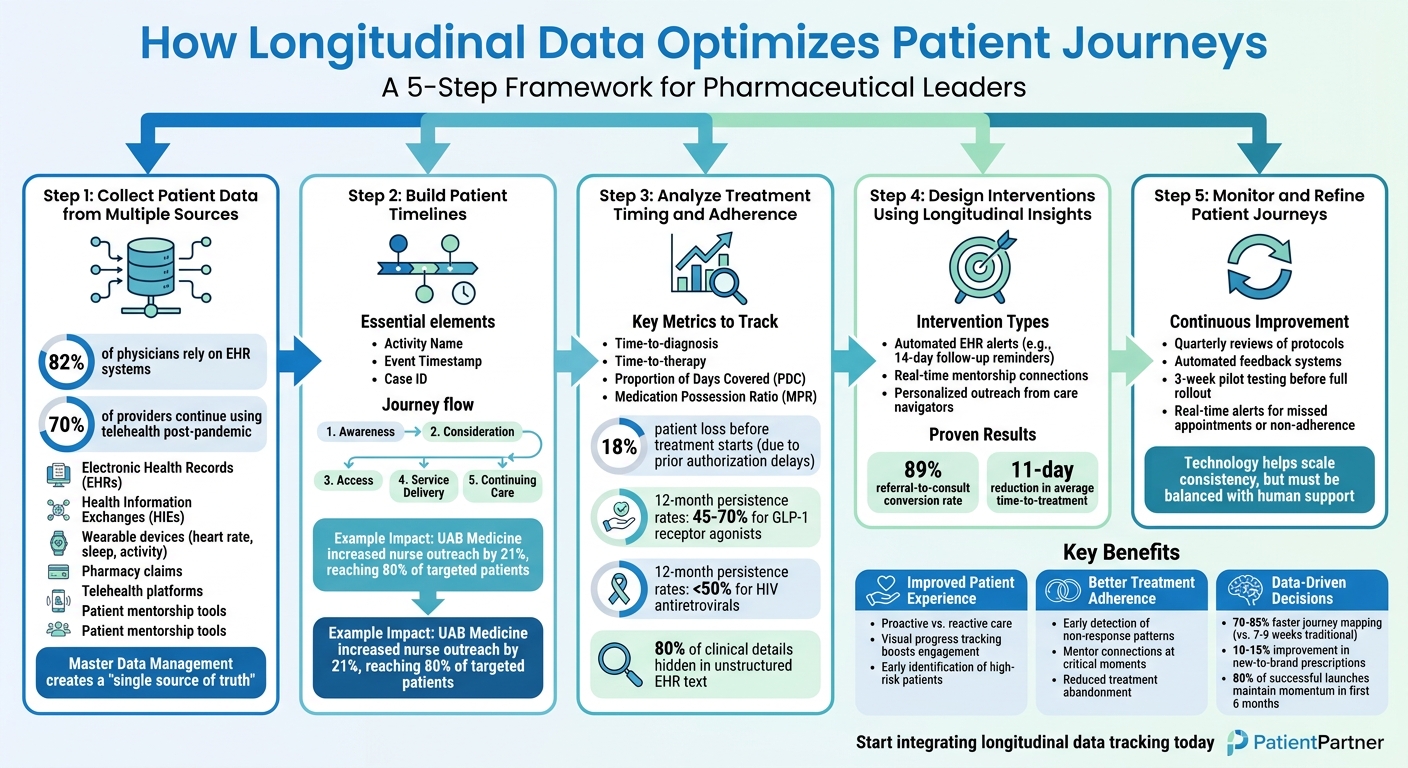
5-Step Process to Optimize Patient Journeys with Longitudinal Data
Introduction to analysing longitudinal data | CLOSER Learning Hub
sbb-itb-8f61039
Step 1: Collect Patient Data from Multiple Sources
Building a complete picture of a patient’s healthcare journey means gathering information from various touchpoints. While 82% of physicians currently rely on EHR systems, these records alone don’t provide the full story. To truly understand how patients move through treatment, you need to bring together clinical records, pharmacy claims, lab results, wearable device data, and patient-reported outcomes into a single, unified framework. This consolidated dataset becomes the backbone for mapping and refining patient journeys.
Key Data Sources
The most comprehensive datasets come from a mix of traditional and emerging sources. Electronic Health Records (EHRs) are a cornerstone, offering critical details like diagnoses, medications, immunizations, allergies, and lab results. Health Information Exchanges (HIEs) expand this by enabling data sharing across healthcare organizations.
Beyond the clinical environment, wearable devices such as smartwatches provide real-time insights into metrics like heart rate, sleep patterns, and physical activity. These devices can even detect potential health issues before symptoms appear.
Telehealth platforms have also become a key component of modern healthcare. Around 70% of providers who adopted telehealth during the pandemic continue to use these technologies. These platforms collect patient-reported outcomes, symptom updates, and real-time interactions outside traditional care settings. Additionally, mentorship tools like PatientPartner (https://patientpartner.com) track engagement, concerns, and adherence by facilitating mentor-patient interactions. This behavioral data uncovers barriers to care that clinical records might overlook.
To make sense of this diverse data, a Master Data Management (MDM) platform is essential. Such a system resolves inconsistencies across disconnected sources, creating a unified "single source of truth" for patient records. Without this integration, the data remains fragmented, offering only disjointed snapshots rather than a continuous timeline.
Ensuring Data Accuracy and Compliance
Accurate data begins with the right matching technology. Simple deterministic matching often fails when minor errors like typos or address changes occur. Advanced probabilistic matching, on the other hand, provides a higher level of accuracy by linking patient records even when discrepancies exist.
Compliance is equally critical. Data collection must adhere to HIPAA's Minimum Necessary Rule, ensuring only the data required for specific analyses is gathered. De-identification of patient data involves removing 18 specific identifiers using methods like Safe Harbor or Expert Determination to reduce re-identification risks. Third-party vendors, including mentorship and analytics platforms, must sign Business Associate Agreements (BAAs) to ensure legal compliance with HIPAA. Additionally, role-based access controls limit who can view sensitive data, while audit trails document every instance of data access.
Healthcare data must be encrypted both at rest and in transit using AES-256 encryption standards. However, it’s important to note that claims data often comes with a delay of 30–90 days, which can complicate real-time treatment adherence tracking. Establishing clear business rules for addressing data gaps - such as distinguishing between a 30-day pharmacy fill gap due to treatment discontinuation or data lag - helps create reliable patient timelines.
Step 2: Build Patient Timelines
After gathering data from various sources, the next step is to organize it into a chronological timeline that outlines the complete patient journey. By turning fragmented data points into visual timelines, you can connect treatments, events, and outcomes in a way that tells a cohesive story. A well-structured timeline not only highlights patterns but also uncovers delays and opportunities for timely interventions. To make this work, events should be arranged into clear, sequential stages that reflect the unique journey of each patient.
Mapping Patient Journeys Across Time
Creating an accurate timeline hinges on three essential elements: Activity Name, Event Timestamp, and Case ID. These components allow you to log events from diagnosis to treatment effectively.
Using precise timestamps - down to the minute or second - helps differentiate between active care and waiting periods. Including both "Event Timestamp" and "Event End Time" provides a clearer picture of actual service times versus delays.
Timelines should be organized into stages from the patient’s perspective, such as Awareness, Consideration, Access, Service Delivery, and Continuing Care. This approach focuses on the patient experience, which can reveal bottlenecks that internal workflows might overlook. For example, while a department may view a transition from radiology to oncology as seamless, the patient may experience a three-week gap filled with anxiety and uncertainty.
Segmenting timelines based on patient persona or condition is also crucial. For instance, chronic care patients have different pathways than post-surgery patients, and blending their data can obscure the unique barriers each group faces. Internal touchpoints, like lab reviews and scheduling, should also be included, as these are often the source of delays patients feel most acutely.
This process builds on earlier data integration efforts and lays the groundwork for designing interventions that address specific pain points.
Tools for Aggregating and Visualizing Data
The right tools can make constructing these timelines manageable, even at scale. Master Data Management (MDM) platforms, such as Coperor by Gaine, consolidate data from disparate systems like EHRs, Laboratory Information Systems (LIS), Radiology Information Systems (RIS), and claims databases into a unified patient record. This "single source of truth" resolves inconsistencies across systems and enables a comprehensive view of the patient journey.
For example, in September 2019, the University of Alabama Birmingham (UAB) Medicine leveraged UpToDate Journeys (formerly EmmiJourneys) to enhance nurse outreach by 21%, successfully contacting 80% of targeted patients. This demonstrates how the right platform can transform raw data into actionable insights that improve patient engagement.
Symphony Health processes around 68 billion healthcare transactions annually, creating a data environment exceeding 14 petabytes. By using advanced tokenization, they de-identify and connect open and closed claims data, enabling longitudinal tracking while maintaining HIPAA compliance. Open claims provide a broad view of care across providers, while closed claims offer detailed, patient-level insights, creating a more complete picture of the care continuum.
Another emerging method is graph database modeling, which creates "digital twins" of patient journeys. This approach represents clinical care as temporal chains, where patients are nodes and encounters are connections. By linking ICD-10 (diagnoses) and CPT (procedures) codes, these systems allow for semantic reasoning. For example, analysts can group various digestive cancers under "neoplasms", making it easier to conduct cohort analysis and risk stratification.
"A longitudinal patient profile refers to a continuous record of a patient's health history and care over multiple encounters with the healthcare system." -
Think of these journey maps as dynamic tools that evolve as new data sources - like wearables, telehealth platforms, or patient mentorship programs - become available. The goal isn’t to create a static diagram but to continuously refine your understanding of the patient journey and identify where interventions can have the most impact.
Step 3: Analyze Treatment Timing and Adherence Patterns
To dive deeper, analyze when treatments begin, how well patients stick to their regimens, and where drop-offs occur by studying patient timelines. Turning static data points into a sequence of events helps uncover patterns that explain why patients may stop therapy.
By measuring the time gaps between key milestones - like diagnosis to first prescription, prescription to first fill, and refill to refill - you can identify where patient behavior veers away from clinical guidelines. For example, tracking "time-to-diagnosis" and "time-to-therapy" can reveal access issues, such as delays caused by prior authorization, which can result in an 18% patient loss before treatment even starts.
Monitoring adherence metrics, such as Proportion of Days Covered (PDC) and Medication Possession Ratio (MPR), at intervals like 30, 60, 90, and 180 days helps identify critical points where many patients discontinue treatment - often referred to as "persistence cliffs". For instance, real-world data shows that 12-month persistence rates are 45–70% for GLP-1 receptor agonists and less than 50% for HIV antiretrovirals.
Another key tool is Line of Therapy (LOT) analysis. This approach uses algorithms to interpret claims and EHR data, mapping out actual treatment paths. LOT analysis highlights switching patterns and shows when patients move to alternative therapies, a factor linked to long-term success for more than 80% of pharmaceutical products that meet their early launch goals.
This level of event tracking lays the groundwork for pinpointing specific adherence challenges.
Identifying Barriers to Adherence
To understand why patients stop therapy, it’s crucial to look beyond structured claims data. A significant portion - around 80% - of critical clinical details, like reasons for switching therapies, side effect severity, and clinician rationale, is embedded in unstructured EHR text. Using Natural Language Processing (NLP) on clinical notes and Medical Science Liaison (MSL) reports can uncover insights such as cost concerns, side effects, or perceived lack of effectiveness.
"Patient journey analytics that ignores unstructured data is working with an incomplete picture of what's actually happening in clinical practice." – Tellius
Barriers often fall into a few major categories:
Understanding these challenges is a critical step for building predictive tools that can anticipate patient behavior.
Predictive Analytics for Better Patient Outcomes
Once adherence barriers are identified, predictive analytics helps turn these insights into proactive strategies. Predictive models can evaluate abandonment risks for new patient referrals in real time, giving healthcare providers an opportunity to intervene before a patient stops treatment. These models use historical data - such as the timing of first prescription fills or prior authorization attempts - to flag high-risk cases.
Visual tools like Sankey diagrams are especially useful for mapping how patients progress from an initial event, like a diagnosis, through various treatment stages. These diagrams clearly show where drop-offs are most severe.
Additionally, continuous journey intelligence - powered by AI - enables real-time monitoring of treatment patterns. This ensures that anomalies are flagged immediately, allowing for timely interventions. By combining timing analysis, adherence metrics, and predictive scoring, you create a system that doesn’t just track patient journeys but actively influences them for better outcomes.
Step 4: Design Interventions Using Longitudinal Insights
Tailoring Interventions to Patient Needs
Using longitudinal data, you can create interventions that are tailored to the unique needs of each patient. By analyzing growth patterns - like rapid early progress, mid-treatment plateaus, or signs of regression - you can pinpoint the right moments to step in with personalized support. For instance, when a patient's progress stalls, timely interventions, such as mentorship check-ins, can help re-engage them before they lose momentum.
With three or more data points, trajectory analysis becomes a powerful tool. It can highlight patients whose progress has stalled for two consecutive measurement periods, signaling the need for intervention to prevent disengagement. Tracking behaviors like medication adherence or appointment attendance over time allows care teams to adjust their approach to better meet individual patient needs.
"Trajectory analysis uses three or more waves to classify participants by growth pattern... This classification enables mid-program intervention - identifying participants who are plateauing while they are still enrolled." – Unmesh Sheth, Founder,
By integrating these insights into existing EHR systems, you can automate real-time alerts. For example, if a patient doesn’t schedule a follow-up within 14 days of a referral, an automated alert can prompt action. Combining these alerts with targeted outreach from care navigators has boosted referral-to-consult conversion rates to 89% and shortened the average time-to-treatment by 11 days.
Real-Time Mentorship as an Intervention
Mentorship in real-time can be a game-changer for patients who show signs of disengagement. Platforms like PatientPartner (https://patientpartner.com) use longitudinal insights to connect patients with mentors who’ve been through similar experiences. Whether it’s starting a new medication or preparing for surgery, these mentors offer personalized guidance that addresses the concerns flagged by data analysis. This kind of support helps bridge engagement gaps and reduces the chances of treatment being abandoned.
Step 5: Monitor and Refine Patient Journeys
Refining patient journeys means turning insights into timely actions through consistent monitoring and adjustments.
Continuous Feedback Loops
Once interventions are in place, tracking longitudinal data shifts healthcare from being reactive to proactive. By observing health trends and engagement patterns over time, you can anticipate needs and act accordingly. This approach ensures interventions are not just timely but also relevant.
The real power lies in merging operational metrics with direct patient feedback into a single system. This combination doesn’t just show what happened - it reveals why. For instance, if there’s a noticeable increase in missed follow-up appointments, patient feedback might uncover that the scheduling process is overly complicated or that reminders aren’t being delivered effectively.
"Gathering patient feedback and understanding perceptions all along the patient journey can help you to identify moments of truth: the touchpoints that have the biggest impact on patient loyalty." –
To make monitoring effective, automated feedback systems are essential. These systems should trigger immediate alerts when issues arise, such as a patient missing an appointment or showing signs of non-adherence. Before implementing any changes across the board, test them with a smaller group over a span of at least three weeks to evaluate their impact. Additionally, conducting quarterly reviews ensures that your processes stay aligned with established protocols and continue to meet patient needs.
This structured feedback system allows for ongoing adjustments, ensuring that care adapts to patients' evolving requirements.
Using Patient Mentorship for Ongoing Support
Once initial interventions are in place, sustained engagement relies on a mix of technology and human connection. While technology can identify when patients are struggling, human mentorship fills the gaps that automation might miss. Platforms like PatientPartner (https://patientpartner.com) integrate mentorship into the care process, using data insights to connect patients with mentors at critical points in their journey.
For example, if data shows that a patient is falling behind - whether by missing doses, skipping appointments, or reducing their online portal activity - mentors who have faced similar challenges can step in to offer personalized advice and encouragement.
"Technology helps scale consistency, but it must be balanced with human support. Automation should remove friction, not make patients feel disconnected or ignored." – Taha Tariq,
Key Benefits of Longitudinal Data for Patient Outcomes
Longitudinal data does more than just track patient information - it reshapes healthcare by enhancing understanding, improving support, and fostering stronger patient relationships. Here’s how it makes a difference:
Improved Patient Experience
Longitudinal data shifts healthcare from being reactive to proactive. Instead of waiting for patients to report issues, historical trends help care teams anticipate problems before they escalate. For instance, identifying high-risk patients early can prevent hospital readmissions by enabling timely interventions.
Another advantage is visual progress tracking, which significantly boosts patient engagement. In behavioral health, for example, showing patients their symptom trends - like PHQ-9 scores over time - offers them tangible proof of improvement. This kind of visual feedback reduces uncertainty and builds trust between patients and their care providers. As Ryan Yannelli from NextVisit.ai puts it:
"When patients can connect daily habits to measurable outcomes, they gain clarity about what's working".
By focusing on patient journeys rather than static metrics, healthcare teams can uncover barriers that might otherwise go unnoticed.
Better Treatment Adherence
Tracking adherence through longitudinal data highlights gaps that could lead to patients discontinuing treatment. Additionally, it prevents ineffective treatment cycles. With a full timeline of medications, side effects, and symptom changes, clinicians can detect non-response patterns early. This helps avoid repeated, ineffective medication trials and accelerates the move to better solutions.
Platforms like PatientPartner (https://patientpartner.com) leverage these insights to connect patients with mentors when the data shows they’re at risk of disengaging. For example, when tracking reveals missed doses, skipped appointments, or reduced portal activity, experienced mentors step in to offer personalized support and mentorship. This human touch provides guidance that automation alone cannot replicate.
Data-Driven Decision Making
Longitudinal data enables faster and more accurate decisions by eliminating guesswork. Traditional methods of creating patient journeys can take 7–9 weeks for each therapeutic area, leaving decision-makers with outdated information. By contrast, AI-powered platforms analyzing longitudinal datasets can cut this time by 70–85%.
This speed is critical. According to IQVIA, 80% of products that meet or exceed launch forecasts in the first six months maintain that momentum. With real-time insights, pharmaceutical leaders can respond quickly to market changes, such as new competitive launches or formulary updates, in days rather than months.
The shift from static metrics to patient trajectories provides a deeper understanding of where interventions are needed. As Linda S., a Data Engineering & Analytics Expert, explains:
"Static metrics told us what was happening. Journey analytics told us where to intervene".
Pharmaceutical teams using AI-driven targeting based on longitudinal data have seen a 10–15% improvement in new-to-brand prescriptions.
Moreover, longitudinal data helps unlock critical insights trapped in unstructured EHR text - where 80% of essential clinical data resides. By synthesizing this information, such as reasons for switching treatments or cost concerns, pharmaceutical leaders gain a clearer picture of patient experiences. This allows them to make decisions that genuinely improve support strategies and patient outcomes.
Conclusion
Summary of Key Steps
Improving patient journeys through longitudinal data requires a structured approach that reshapes how pharmaceutical companies engage with and support patients. The process involves five key steps: gathering data from various sources, creating patient timelines, studying treatment timing and adherence trends, designing tailored interventions, and consistently tracking outcomes. Each step builds on the one before it, turning raw data into actionable insights that identify and address barriers to care.
Transitioning from a reactive to a proactive care model leads to better outcomes for everyone involved. As Piyushi Sharma from the Journal of Information Systems Engineering and Management explains, "The transformation from reactive to proactive care delivery benefits patients, providers, and payers alike". This shift replaces guesswork with data-backed strategies, enabling teams to focus their efforts where they can make the biggest difference.
These findings highlight the urgency for action among industry leaders.
Call to Action for Pharmaceutical Leaders
With this framework in place, pharmaceutical companies must take the next step - turning these insights into tangible improvements in patient care.
The industry is shifting toward continuous monitoring of treatment patterns in real time, moving away from outdated 7–9-week reporting cycles. Leaders who embrace longitudinal data strategies early position themselves for long-term success. According to IQVIA, 80% of products that achieve or surpass their first-year launch forecasts maintain that performance over time. This underscores the importance of establishing strong patient support systems within the first six months of a product's launch.
A great example of this in action is PatientPartner (https://patientpartner.com), which uses longitudinal data to enhance patient support. When the platform detects red flags like missed doses, skipped appointments, or reduced engagement, it connects at-risk patients with experienced mentors. These mentors provide personalized support, filling gaps that automated systems alone cannot address. This approach combines the power of data with the human touch to deliver meaningful results.
The tools are here - technology, data, and measurable outcomes are all within reach. Start integrating longitudinal data tracking today to better support your patients and strengthen your market position.
FAQs
What counts as longitudinal data in healthcare?
Longitudinal data in healthcare provides a detailed timeline of a patient’s medical history. It includes information such as diagnoses, treatments, medication adherence, appointment attendance, and overall health progress. By covering multiple care encounters across different organizations, it creates a thorough picture of a patient’s health over time.
How do you match patient records across systems without exposing identities?
Patient records are connected across systems using de-identified or anonymized data, ensuring privacy while preserving the ability to link information. This involves generating secure datasets where personal identifiers are either removed or obscured. Methods like relying on non-sensitive health information and employing identity management tools designed for de-identification enable precise matching without exposing individual identities.
Which journey drop-offs should teams fix first?
Teams should pay close attention to moments when patients are most likely to disengage - like during the initial diagnosis, treatment changes, or after being discharged. These are critical junctures where patients often drop off. Focusing on high-impact areas, such as early treatment abandonment or missed follow-up appointments, can make a big difference in retention and health outcomes. Using long-term data alongside behavioral insights can help pinpoint the best opportunities for intervention, ultimately boosting adherence and improving patient care.
Related Blog Posts
- Longitudinal Data Insights for Pharma Executives
- Using Sentiment Data to Predict Patient Drop-Off Risks
- Real-Time Patient Journey Tracking Explained
- From Insights to Impact: How Advanced Analytics Are Shaping Patient Engagement
{"@context":"https://schema.org","@type":"FAQPage","mainEntity":[{"@type":"Question","name":"What counts as longitudinal data in healthcare?","acceptedAnswer":{"@type":"Answer","text":"<p>Longitudinal data in healthcare provides a detailed timeline of a patient’s medical history. It includes information such as diagnoses, treatments, medication adherence, appointment attendance, and overall health progress. By covering multiple care encounters across different organizations, it creates a thorough picture of a patient’s health over time.</p>"}},{"@type":"Question","name":"How do you match patient records across systems without exposing identities?","acceptedAnswer":{"@type":"Answer","text":"<p>Patient records are connected across systems using <strong>de-identified</strong> or <strong>anonymized data</strong>, ensuring privacy while preserving the ability to link information. This involves generating secure datasets where personal identifiers are either removed or obscured. Methods like relying on non-sensitive health information and employing identity management tools designed for de-identification enable precise matching without exposing individual identities.</p>"}},{"@type":"Question","name":"Which journey drop-offs should teams fix first?","acceptedAnswer":{"@type":"Answer","text":"<p>Teams should pay close attention to moments when patients are most likely to disengage - like during the initial diagnosis, treatment changes, or after being discharged. These are critical junctures where patients often drop off. Focusing on high-impact areas, such as early treatment abandonment or missed follow-up appointments, can make a big difference in retention and health outcomes. Using long-term data alongside behavioral insights can help pinpoint the best opportunities for intervention, ultimately boosting adherence and improving patient care.</p>"}}]}
Author