


Comparing Metrics: Patient Engagement vs. Adherence
Key Takeaways
Author


Patient engagement and adherence are two different ways to measure patient behavior in healthcare programs. Engagement focuses on how involved and motivated a patient is in their care, while adherence measures whether they follow their prescribed treatment plan. Both metrics are important for evaluating the success of mentorship programs and improving health outcomes.
Key Points:
- Patient Engagement: Reflects mindset and active participation (e.g., asking questions, using educational resources). Measured through tools like app usage, Patient Activation Measure (PAM) scores, and mentor interactions.
- Patient Adherence: Tracks behavioral compliance (e.g., taking medication, attending appointments). Measured using metrics like Proportion of Days Covered (PDC) and Medication Possession Ratio (MPR).
- Mentorship's Role: Mentors help improve both engagement and adherence by building trust, providing emotional support, and addressing barriers like confusion or lack of confidence.
Quick Comparison:
| Feature | Patient Engagement | Patient Adherence |
|---|---|---|
| Focus | Mindset and active participation | Behavioral compliance |
| Data Type | Qualitative and ongoing | Quantitative and measurable |
| Key Drivers | Motivation, trust, perceived support | Protocol compliance |
| Timing | Starts before treatment | Measured after treatment begins |
| Role in Programs | Leading indicator (early signals) | Lagging indicator (outcomes) |
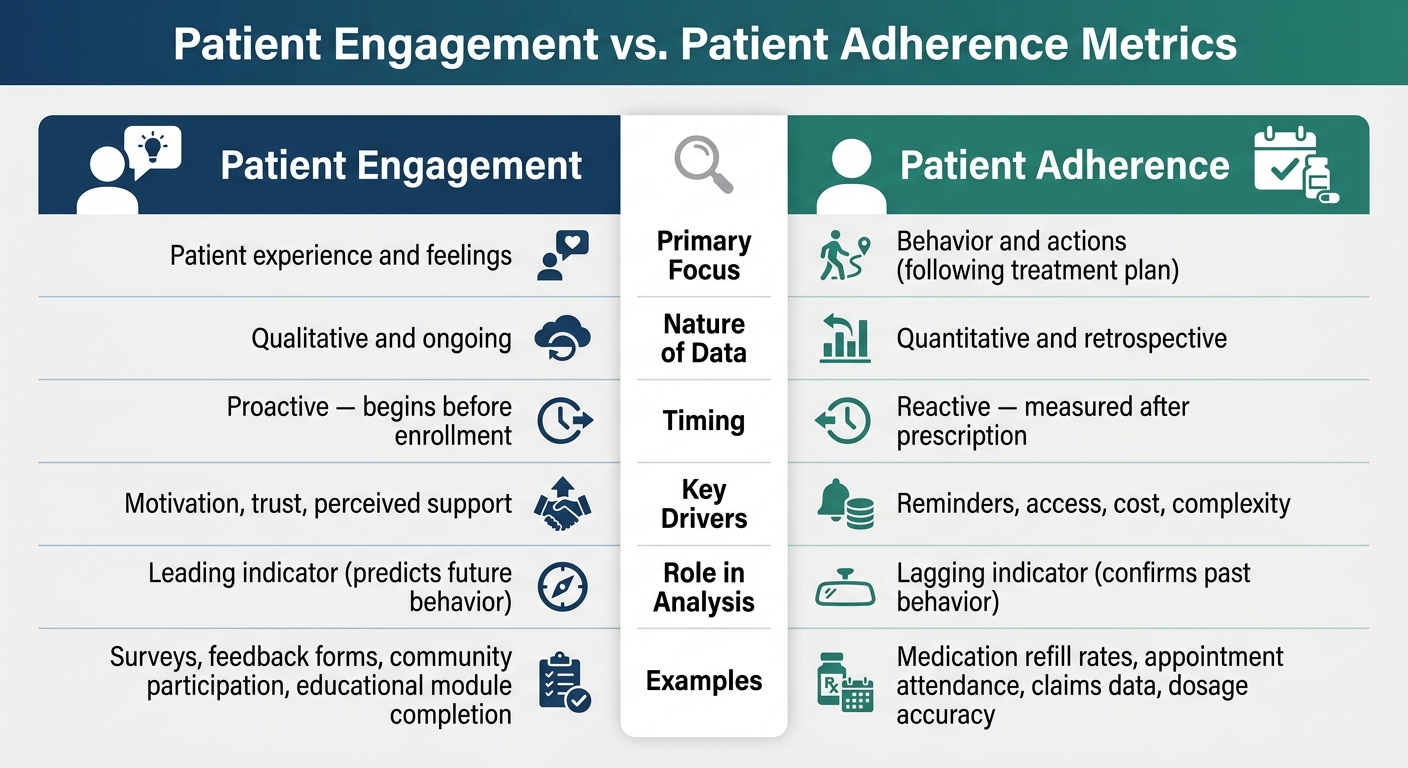
Patient Engagement vs. Adherence Metrics: Key Differences at a Glance
Patient Engagement Metrics: How Participation Is Measured
Understanding engagement goes beyond surface-level actions. Metrics now offer a way to quantify deeper involvement, shedding light on patients' mindsets and motivations.
Common Engagement Metrics
Engagement metrics typically fall into three main areas: digital interactions, educational content usage, and Patient Activation Measure (PAM) scores.
- Digital interaction rates track behaviors like app logins, portal activity, and response times.
- Educational content usage measures how much time patients spend engaging with resources like guides, videos, or health modules.
- PAM scores evaluate a patient’s knowledge, skills, and confidence on a 0–100 scale. Higher PAM scores are often linked to better health outcomes.
In mentorship programs, the frequency and nature of mentor-mentee interactions are also critical. Utilizing an AI mentor can further enhance these interactions by providing consistent, empathetic support. For example, tracking whether patients initiate conversations or only respond when prompted provides insight into their motivation and level of support.
These metrics help create opportunities for timely interventions, especially in mentorship settings.
How Engagement Data Is Used in Mentorship Programs
Engagement data plays a key role in identifying at-risk patients and assessing the success of mentor-mentee relationships. For instance, if a patient’s weekly check-ins drop suddenly, program coordinators can step in quickly. Platforms like PatientPartner use real-time sentiment analysis to trigger specific interventions, ensuring patients stay engaged and supported throughout the mentorship process.
Strengths and Limitations of Engagement Metrics
Engagement metrics serve as early warning signs, helping to catch potential issues - like missed appointments or medication lapses - before they escalate. However, frequent interactions alone don’t always guarantee better outcomes. For example, a patient logging into an app every day doesn’t necessarily mean they feel supported or understand their care plan.
As noted in an industry analysis:
"there is a need for more tools to measure metrics other than patient experience of patient engagement" – Springer Nature/Novartis
Another challenge lies in the lack of standardization across the industry. Terminology and tools vary widely, making it difficult to fully evaluate the impact of patient engagement. While quantitative data, such as the number of mentor check-ins, shows activity, it doesn’t explain the reasons behind these interactions or their effects on a patient’s overall well-being. To get a more complete picture, combining numerical data with qualitative feedback is essential.
sbb-itb-8f61039
Patient Adherence Metrics: How Follow-Through Is Measured
While engagement metrics show if patients are showing up, adherence metrics dig deeper, focusing on whether they’re actually sticking to their treatment plans. These metrics track specific behaviors like filling prescriptions, completing therapy, and following a prescribed regimen. Together with engagement data, they provide a more complete picture of patient follow-through in mentorship programs.
Common Adherence Metrics
Two key metrics often used are Proportion of Days Covered (PDC) and Medication Possession Ratio (MPR). Both rely on pharmacy claims data but are calculated differently:
- PDC measures the percentage of days a patient has their medication on hand during a set period.
- MPR divides the total days' supply of medication by the number of days in the measurement window.
PDC is generally more reliable since it avoids overestimating adherence due to early refills. Beyond these, mentorship programs also track therapy completion rates (the percentage of patients completing prescribed treatments) and behavioral goal tracking, which monitors actions like attending appointments or finishing educational modules. Together, these metrics provide a well-rounded view of how well patients are sticking to their treatment plans.
How Adherence Data Is Used in Mentorship Programs
Adherence data plays a critical role in assessing the impact of mentorship on treatment outcomes. For instance, PatientPartner uses these metrics to compare mentored patients with a control group, quantifying the "mentor effect." If a mentored patient’s PDC score improves over a 90-day period compared to a non-mentored peer, it’s a clear, data-backed indication of the mentorship program’s effectiveness.
"By transferring responsibility for obtaining and administering complex and costly medications to patients in the community setting, patient behavior becomes a major influence on the effectiveness and costs of care." – Arijit Ganguli, Department of Health Economics and Outcomes Research, AbbVie
In addition to tracking outcomes, adherence data helps mentorship programs identify where patients may be dropping off. Using the ABC taxonomy framework - Initiation, Implementation, Persistence - programs can determine whether patients are failing to start medication, struggling with daily dosing, or discontinuing therapy altogether.
Strengths and Limitations of Adherence Metrics
Adherence metrics are powerful because they directly tie to clinical outcomes. As noted:
"Medication adherence is a key determinant of treatment adequacy, achievement of clinical goals, and improved health outcomes." – BMC Psychology
Higher adherence often leads to better disease management and lower healthcare costs. However, claims data has its limitations - it confirms possession of medication but not actual use. Studies show that nearly 50% of patients with chronic conditions fail to stick to their prescribed regimens. Tools like the MARS-5, which rely on self-reporting, can uncover behavioral reasons for non-adherence, though patients often overestimate their compliance.
Mentorship programs help bridge this gap. By combining objective refill data with insights from mentor-mentee conversations, they can uncover hidden barriers like forgetfulness, side effects, or lack of understanding - issues that claims data alone can’t reveal. This blend of quantitative and qualitative data makes mentorship a valuable tool in improving adherence and, ultimately, patient outcomes.
Engagement vs. Adherence Metrics: A Direct Comparison
Building on earlier definitions, this section takes a closer look at how engagement and adherence metrics operate within mentorship programs.
Key Differences Between Engagement and Adherence Metrics
At their core, engagement captures how patients feel, while adherence tracks what they do. Engagement reflects a patient’s motivation, trust in the program, and the level of support they perceive. Adherence, on the other hand, measures whether patients stick to their treatment plans - like filling prescriptions, completing therapy, or meeting program milestones.
The way these metrics are gathered also differs. Engagement data is qualitative and collected continuously through tools like mentor conversations, surveys, and participation logs. Adherence data, however, is quantitative, pulled from sources such as pharmacy claims, prescription pickups, and therapy completion rates. Together, these provide actionable insights for improving patient services and mentorship programs. Engagement efforts typically start even before formal enrollment, focusing on trust-building, while adherence is tracked after treatment begins.
How Engagement and Adherence Relate to Each Other
Understanding the distinction between these metrics also highlights how they are interconnected. Engagement often serves as a predictor for adherence. A drop in engagement can signal potential adherence issues before they appear in hard data.
"Retention is the outcome. Engagement is the work." – mdgroup
This connection is crucial for mentorship programs. For instance, if a patient begins skipping mentor check-ins, stops responding, or disengages from educational materials, these behaviors might hint at a future lapse in adherence. Often, patient dropout stems from small, compounding issues - like travel fatigue, scheduling conflicts, or unclear instructions. Engagement metrics can catch these problems early, while adherence metrics confirm the resulting impact.
"You can't 'fix' retention late in a trial without addressing engagement earlier on." – Alex Cheesman, mdgroup
The table below provides a side-by-side comparison for clarity.
Engagement vs. Adherence Metrics: Side-by-Side Table
| Feature | Patient Engagement | Patient Adherence |
|---|---|---|
| Primary Focus | Patient experience and feelings | Patient behavior and actions |
| Nature of Data | Qualitative and ongoing | Quantitative and measurable |
| Timing | Proactive; begins before enrollment | Measured after enrollment/start |
| Key Drivers | Motivation, trust, perceived burden | Protocol compliance and completion |
| Role in Analysis | Leading indicator ("the work") | Lagging indicator ("the outcome") |
| Common Data Sources | Mentor notes, surveys, participation logs | Pharmacy claims, prescription pickups, completion rates |
| Diagnostic Value | Explains why patients disengage | Shows when patients stop following protocol |
Using Both Metrics to Improve Mentorship Programs
Neither engagement nor adherence data can paint the full picture on their own. By combining these metrics, mentorship programs can gain a clearer understanding of their effectiveness and make better adjustments.
Combining Metrics to Identify Program Gaps
When engagement and adherence data are analyzed together, they reveal gaps that might otherwise be overlooked. For example, if engagement is high but adherence is low, it could point to external challenges like medication costs or side effects rather than a lack of motivation. On the other hand, patients who seem adherent but show declining engagement might be experiencing early signs of burnout or confusion. While this may not yet impact their treatment behavior, it likely will if left unaddressed.
"Integrating patient activation and the patient-doctor relationship into healthcare delivery is essential for improving medication adherence." – BMC Psychology Research
Patient Segmentation and Targeted Intervention
By combining metrics, mentorship programs can better segment patients and tailor interventions. Tools like PAM-13 help categorize patients based on their knowledge, confidence, and self-management skills. Patients with lower activation scores often need more frequent and focused mentorship to stay on track.
PatientPartner exemplifies this approach by using data-driven segmentation across its network of over 30,000 patients and 500+ mentors, covering 150+ disease states. Through real-time sentiment analysis of mentor-patient interactions, the platform can detect signs of frustration or confusion. This allows for immediate outreach to prevent adherence from slipping. As Sara W., a Marketing Director, shared after reviewing PatientPartner's engagement data:
"We knew patient trust was shifting, but seeing just how dramatically patients now prefer peer-to-peer engagement over traditional methods is a game-changer for our upcoming strategies." – Sara W., Marketing Director
How Enterprise Stakeholders Can Act on Metric Insights
For pharmaceutical and med-tech teams, the key question is: how can this data be put into action? The first step is ensuring visibility. Real-time dashboards that track both engagement and adherence provide stakeholders with the tools to identify and address gaps. Strengthening patient-doctor relationships through mentorship content - not just providing information - often leads to better adherence outcomes. Additionally, transitioning adherent patients into mentorship roles creates a feedback loop. These patients, identified through adherence data, often make highly relatable and effective mentors for others.
Conclusion: Why Both Metrics Matter for Mentorship Program Success
Patient engagement and adherence play distinct but interconnected roles in determining the success of mentorship programs. Engagement shows whether the program is fostering trust and keeping patients actively involved, while adherence demonstrates whether that involvement leads to meaningful clinical outcomes. Together, these two metrics provide a more complete picture of a program's performance, offering insights that can help differentiate programs that achieve lasting results from those that stagnate.
The real takeaway here isn’t about the limitations of each metric on its own, but rather how the two work together to create a feedback loop. For example, high engagement without adherence often points to unresolved structural challenges, while high adherence without engagement suggests a fragile routine that external factors could easily disrupt. Addressing one without the other simply isn’t sustainable.
A study involving 431 patients highlighted this dynamic. It found that the connection between patient activation and medication adherence became significantly stronger when the quality of the patient-doctor relationship was considered - resulting in a total association of 0.169. This underscores the importance of relationships in driving patient follow-through, beyond just the information shared. For pharmaceutical and med-tech stakeholders, this dual-metric approach strengthens the case for mentorship programs by providing clear evidence of treatment effectiveness, brand trust, and return on investment. PatientPartner’s platform leverages this principle, using real-time data from both metrics to help program managers address challenges before they escalate.
Success in mentorship programs comes from treating patients as whole individuals rather than just numbers on a chart. By tracking both engagement and adherence, programs can stay transparent about their strengths and weaknesses, adapt to patient needs, and deliver measurable outcomes. Combining these metrics is key to creating programs that truly make a difference.
FAQs
Which engagement metrics matter most for predicting adherence?
When it comes to predicting adherence, the most telling engagement metrics focus on a patient’s mindset and involvement in their own care. One standout tool is the Patient Activation Measure (PAM). Higher PAM scores reflect greater confidence and better self-management skills, both of which are closely tied to improved adherence.
Another important metric is tracking patient mentor engagement rates. Regular, meaningful interactions with mentors can tackle obstacles and provide the support needed to stick with treatment over the long haul. These real-time insights are invaluable for identifying challenges and boosting success.
How can we tell if high engagement is actually improving outcomes?
Tracking measurable health metrics alongside engagement data can help determine if high engagement leads to better outcomes. Programs with strong participation and satisfaction rates often show tangible benefits, such as a 25% boost in adherence, 15–20% improvement in clinical outcomes, or even a 30% reduction in hospital readmissions. Tools like PatientPartner focus on Key Impact Indicators - such as therapy duration and clinical markers - to validate that engagement strategies are making a real difference in health outcomes.
What’s the best way to act on patients who are engaged but not adherent?
To assist patients who are engaged but struggle to stick with their treatment plans, it's important to pinpoint obstacles such as fear of side effects, challenges with administering treatments, or confusion about their prescribed regimen. PatientPartner tackles these issues by linking patients with seasoned mentors. These mentors offer tailored advice, practical tips, and emotional encouragement, turning initial engagement into steady adherence.