


How AI Cloud Analytics Improves Patient Adherence

Key Takeaways
Author


AI cloud analytics helps teams find adherence risk earlier, match support to the likely problem, and track whether that support actually works. That matters because about 20%–30% of prescriptions are never filled, about 50% of patients do not stay on treatment as prescribed, and nonadherence may cost the U.S. about $100 billion–$300 billion per year.
If I boil the article down, the process is simple:
- Pull the right data together: pharmacy fills, appointments, labs, support contacts, device signals, and patient-reported issues
- Define nonadherence clearly: missed starts, refill gaps, treatment stops, or low PDC
- Protect patient data: HIPAA controls, audit logs, role-based access, and clear team ownership
- Use prediction carefully: risk scores should help staff review cases, not make treatment decisions alone
- Explain each flag: late refills, missed visits, side effects, cost issues, or transport trouble
- Match outreach to the barrier: reminders for timing issues, billing help for cost, clinician follow-up for side effects, or human mentorship for hesitation
- Measure results over time: initiation, refill timing, persistence, missed visits, subgroup results, and model drift
What stood out to me most is this: a risk score is only useful when it leads to the right human follow-up. A refill gap does not always mean a patient chose to stop. It may point to cost, confusion, side effects, pharmacy changes, or a pause approved by a clinician.
Here’s the article’s core message in one line: use cloud-based AI to spot risk early, keep a person in the loop, and judge success by patient outcomes - not by alerts alone.
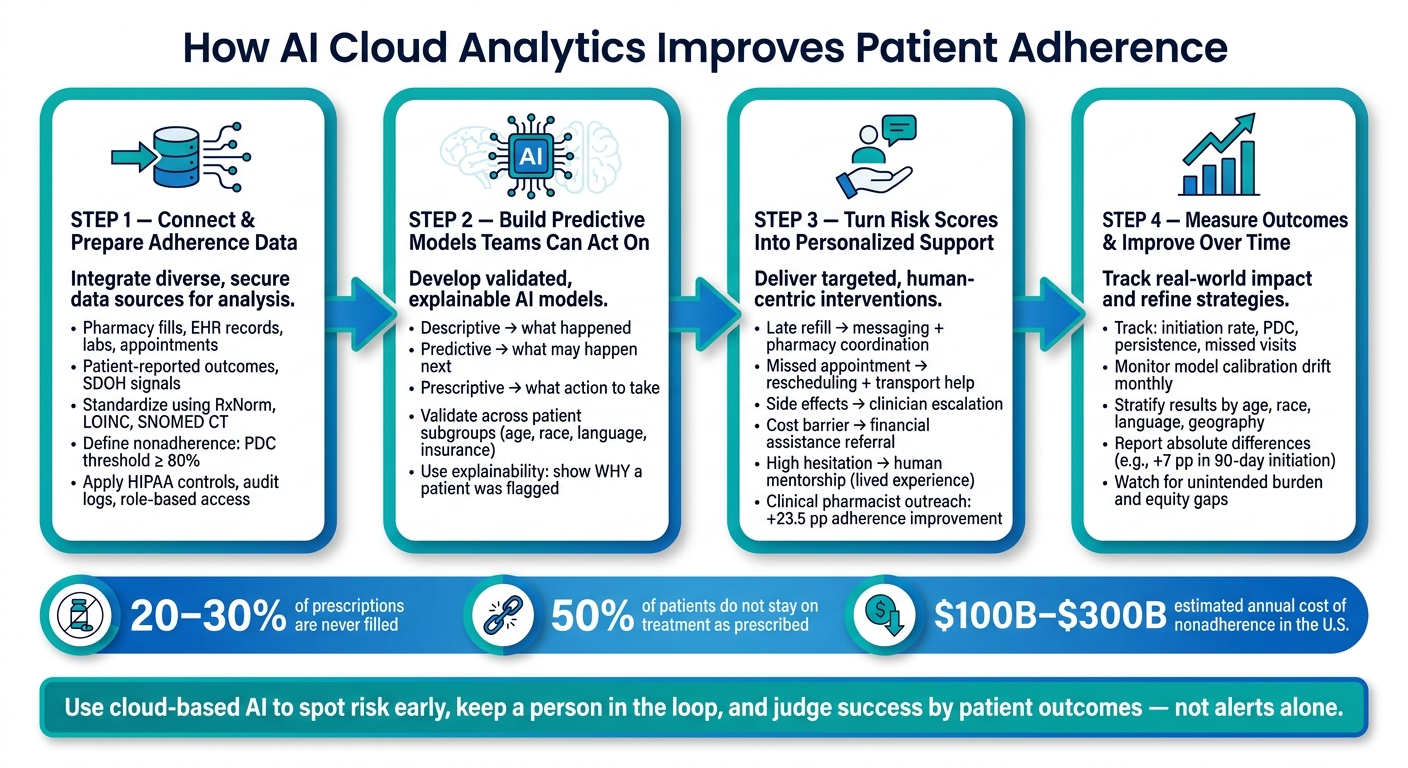
AI Cloud Analytics for Patient Adherence: 4-Step Process
Improving Patient Adherence: SAS Medication Adherence Risk
sbb-itb-8f61039
Step 1: Connect and Prepare Adherence Data
Before any AI model enters the picture, the data base has to be clean and consistent. If records are incomplete or don't match across systems, the model will miss the people who need help most.
Identify Data Sources That Signal Adherence Risk
Start with pharmacy dispensing and refill history: prescription date, medication, dose, quantity, days' supply, fill date, and fill status. AHRQ says the main way to estimate medication adherence from electronic data is to link e-prescribing data with pharmacy-fill data. Two common sources are insurer or pharmacy-benefit-manager (PBM) claims and medication-history transactions from the Surescripts e-prescribing network.
Dispensing data has a clear limit: it shows that a medication was picked up, not that it was taken. So pull in more context. Add EHR medication lists, lab results, clinical encounters, patient-reported outcomes, patient services and support contacts, and device or app events that are legally usable. Bring in relevant SDOH too, including transportation, housing, food access, language, and affordability.
Each data source should answer a specific question. A delayed refill can hint at cost or access problems. Repeated symptom reports may point to side effects. A missed appointment can suggest the patient is drifting away from care. To keep this data lined up across systems, use interoperable standards. ONC's USCDI framework covers medications, clinical notes, allergies, and laboratory results. RxNorm, SNOMED CT U.S. Edition, LOINC, and NDC codes help keep medication and event data consistent.
That mix of signals gives care teams a way to spot trouble early, before a missed refill turns into a full treatment drop-off.
Once you've nailed down the inputs, the next job is to standardize them under one adherence definition.
Standardize Records and Define What Counts as Nonadherence
"Nonadherence" needs a precise, therapy-specific definition before you calculate anything. Depending on the treatment, it may mean a missed dose, a refill gap beyond the prescribed days' supply, failure to start therapy, a temporary interruption, or documented discontinuation.
For chronic therapy, use proportion of days covered (PDC), which measures the share of days a patient has medication on hand. CMS and the Pharmacy Quality Alliance use PDC-based adherence measures, and a threshold of at least 80% is used for several established measures. PDC is usually preferred over medication possession ratio because it doesn't count overlapping supply more than once.
A refill gap, though, is not proof that a patient stopped taking a medication. They may have been hospitalized, switched pharmacies, received samples, or paused treatment under clinical guidance. That's why the prep work matters so much. Your pipeline should explicitly handle:
- duplicate records
- missing days' supply values
- reversed claims
- early refills
- pharmacy transfers
- conflicting statuses
- discontinued prescriptions
- inconsistent drug names or strengths
Store dates internally in ISO 8601 format, then display them as MM/DD/YYYY for U.S.-facing users. Keep the original source value alongside the normalized value so each record stays traceable during an audit.
After the data is normalized, governance rules decide who can use it, and under what conditions.
Set Governance, Privacy, and Workflow Requirements
Moving adherence data into the cloud still brings HIPAA obligations with it. HHS states that the HIPAA Security Rule requires access controls that limit electronic protected health information to authorized users, along with audit controls that record and examine activity in systems that contain or use that information.
On the ground, that means role-based access, unique user identification, audit logging, encryption, backup procedures, and tested incident-response plans before a single risk score is produced.
Ownership also needs to be clear across clinical, privacy, security, data engineering, and patient-support teams. A data steward should maintain definitions and source contacts. A clinical owner should approve adherence thresholds. Compliance and legal teams should review state privacy laws, consent terms, and business-associate agreements, especially when the data touches sensitive categories like behavioral health, reproductive health, or SDOH. Keep development, testing, and production environments separate, and de-identify data for experimentation whenever possible.
It's also smart to design the workflow before locking down the pipeline. Decide who gets an alert, how fast it needs review, what actions are allowed, and how outreach preferences will be honored. A risk score can't just float around in a dashboard. It needs a named reviewer and a clear action path.
With that groundwork in place, teams are ready to move from data prep to models they can actually use.
Step 2: Build Predictive Models Teams Can Act On
With the standardized data from Step 1 in place, the next move is to build risk scores that help teams decide who may need outreach, what kind of outreach fits, and when it should happen. The aim is simple: flag the right patient for the right outreach at the right time. These scores should support human review, not make outreach calls on their own.
Understand the Difference Between Descriptive, Predictive, and Prescriptive Analysis
Not all analytics are built for the same task.
Descriptive analysis looks back. It tells you what already happened, such as a patient missing two refills in the past six months.
Predictive analysis looks ahead. It estimates the chance that the same patient will miss the next refill within a set window, like 30 days.
Prescriptive analysis goes one step further. It suggests what to do next, whether that means sending a reminder, sharing transportation information, or routing the patient to a support specialist.
A risk score can help teams sort and prioritize outreach, but it should not automatically drive a clinical treatment decision.
| Analysis type | Purpose | Output | Principal limitation |
|---|---|---|---|
| Descriptive | Explain what happened | Trends, counts, and adherence history | Does not estimate future risk |
| Predictive | Estimate what may happen next | Probability or risk tier for a future adherence event | Can be inaccurate, biased, or poorly calibrated |
| Prescriptive | Recommend the next support action | Recommended or prioritized intervention | May build in biased assumptions without human oversight |
Validate Models for Accuracy, Calibration, and Performance Across Patient Groups
Before a model enters a live patient workflow, it has to show that it works on more than the data used to build it. That means using a training set to fit the model, a validation set to tune settings and compare options, and a separate test set to get a final read on performance. In healthcare, a time-based split often makes more sense than a random split: train on earlier records and test on later ones.
You also need to report the right metrics. Look at sensitivity, specificity, false-positive rate, discrimination, and calibration. Calibration matters because it shows whether predicted risk lines up with what later happened in the real data.
Then check performance across patient groups, including age, race and ethnicity, language, insurance type, and treatment. This is where things can get messy. A model may look fine at the top level but still miss patients with fewer digital records or flag other groups too often. If performance falls short for a given group, recalibrate the model, adjust thresholds, or hold back deployment until the problem is fixed.
Only models that perform well across patient groups should move into review workflows.
Use Explainability to Support Human Review
A risk score by itself doesn't give reviewers enough to act on. People on commercial, patient-experience, or compliance teams need to know why a patient was flagged before deciding what happens next. Show the main drivers in plain language, such as repeated late refills, a recent missed appointment, a long gap since the last patient-reported dose, or a documented transportation concern.
Those factors should be shown as signals, not as proof. A refill gap, for example, does not mean a patient is unwilling to stay on treatment. It could point to cost, transportation, side effects, confusion, changing clinical instructions, or plain old missing data. That's the whole point of explainability: it helps reviewers approve, reject, or reroute outreach based on context instead of guesswork.
The FDA describes transparency as communicating appropriate information about a model's intended use, development, performance, and - when available - its logic to relevant audiences.
That standard fits this use case well. The model helps sort risk. A human still makes the call.
Once risk is both reliable and explainable, each score can be tied to a specific outreach action. The next step is turning validated risk into personalized support. This often involves mentorship programs that influence patient decision-making and long-term adherence.
Step 3: Turn Risk Scores Into Personalized Patient Support
A validated risk score shows who might need help. That score should trigger a review, not act as proof of the barrier. After that, connect each signal to the smallest step that can actually help.
Match the Intervention to the Likely Barrier
Build an intervention ladder that links common signals to approved actions. The key is simple: match the level of support to the barrier. When needs are more complex, pharmacist outreach often does better than automated reminders. A 2025 review found that clinical-pharmacist outreach produced a median adherence improvement of 23.5 percentage points, compared with 17.8 points for medication synchronization, 14.6 points for pharmacy-technician telephone outreach, and 10.7 points for automated digital reminders.
| Signal | Likely barrier | Recommended response |
|---|---|---|
| Late or missed refill | Timing, access, or cost | Message on the patient's preferred channel, pharmacy coordination, coverage support |
| Missed appointment or treatment administration visit | Scheduling or transportation | Appointment follow-up, rescheduling support, transportation assistance |
| Repeated questions about dosing or administration | Administration uncertainty | Plain-language education, teach-back, pharmacist or nurse consultation |
| Reported or suspected side effects | Tolerability concern | Nonjudgmental check-in, prompt escalation to a clinician |
| High out-of-pocket cost or coverage gap | Financial or access barrier | Billing and coverage support, financial-assistance referral |
| Long gaps between treatment-related interactions | Unclear or evolving needs | Check-in, treatment-planning assistance |
Sometimes the signal points one way, but the patient's own explanation tells a different story. When that happens, update the record so the next outreach fits the person better instead of repeating the same wrong assumption.
Add Human Mentorship When Patient Hesitation Is High
When the barrier is uncertainty, not logistics, mentorship can make a big difference. Some patients don't need help with scheduling or refill timing. They need someone to talk to. If analytics point to fear, uncertainty, or low confidence, offer a human conversation without pushing it.
PatientPartner can add real-time mentorship for patients who need reassurance, education, or encouragement. Mentors should share lived experience only. They must not diagnose, change treatment, or take the place of clinicians.
Keep Outreach Compliant, Respectful, and Preference-Aware
Each outreach step should follow the patient's stated communication preferences. Use only consented preferences for channel, language, accessibility, timing, opt-out status, and caregiver permissions.
Keep it tight and respectful. Use the minimum necessary information. Never expose sensitive details in voicemail or on shared devices. And don't use language that labels the patient nonadherent.
Risk scores flag who may need review. A qualified professional, together with the patient, decides what happens next. From there, track which actions help adherence and which ones create friction.
Step 4: Measure Outcomes and Improve the Program Over Time
A risk score doesn't matter if it doesn't improve adherence. Once outreach starts, the next job is simple to state and harder to prove: did it change behavior? This step checks whether the personalized support from Step 3 actually moved adherence in the right direction.
Track Model Performance and Patient Outcomes
Use two scorecards side by side. One should track model performance in production, including drift, calibration, and subgroup results. The other should track patient and operational outcomes. Looking at only one of them gives you half the picture.
The table below shows the core metrics, what each one measures, why it matters, and how often to review it.
| Metric | What it measures | Why it matters | Review frequency |
|---|---|---|---|
| Treatment initiation | Percentage of eligible patients who start therapy within the defined window | Shows whether access, approval, education, and early support are working | Weekly or monthly |
| Medication coverage and continuity | Refill timeliness within the refill window, PDC, persistence without a defined treatment gap, and discontinuation rate | Tracks whether patients have medication on hand, stay on therapy, and when treatment ends | Monthly and quarterly |
| Missed appointments | Missed or canceled visits relative to scheduled visits | May reveal transportation, scheduling, affordability, or symptom-related barriers | Weekly or monthly |
| Patient-reported barriers | Reported reasons for nonadherence, such as side effects, cost, confusion, stigma, or lack of support | Helps teams choose an intervention that addresses the actual barrier rather than assuming it | Monthly, with quarterly review |
| Intervention uptake | Percentage of recommended interventions accepted, completed, or resulting in successful contact | Shows whether predictions translate into delivered support | Weekly or monthly |
| Model calibration over time | Agreement between predicted risk and observed outcomes across risk groups | Determines whether a score remains trustworthy for decision-making | Monthly during launch; at least quarterly after stabilization |
| Equity-stratified outcomes | Post-deployment drift and unequal intervention benefit across race and ethnicity, language, age, disability, geography, and insurance | Detects whether AI-driven support helps the right patients and misses others | Monthly or quarterly, depending on risk |
Compare results against a baseline, a matched group, or a randomized rollout. Report absolute differences too, not just relative lift. For example, a 7-percentage-point increase in 90-day initiation says more than a vague claim that performance improved. Include confidence intervals as well, because a high message-delivery rate doesn't prove that patients started or stayed on treatment.
And here's the part teams sometimes miss: if the scorecard looks better but the outreach adds burden, the program still needs work.
Watch for Unintended Effects and Equity Gaps
Track both benefit and burden. Then look closely at who benefits and who doesn't. Too much outreach, repeated contacts, or messages that miss the mark can weaken trust and frustrate patients. A false positive can lead to calls or reminders a patient never needed. A false negative can leave someone without help when they needed it most.
Break out results by:
- age
- race and ethnicity
- language
- geography
- insurance type
- disability status
- digital access
Big summary numbers can hide poor results for specific groups. That's why stratified review matters. If you move the model into a new population or a new therapy area, revalidate it before use. And if calibration drifts or subgroup gaps get worse, treat that as a signal to investigate right away - not something to put off until the next review cycle.
Governance also needs clear ownership. Assign named owners for monitoring, set escalation thresholds in advance, and document every model and data change. If opt-out rates climb, complaints increase, or equity gaps grow, pause automated recommendations and require clinical review before moving ahead.
Conclusion: A Practical Sequence for Responsible Deployment
The full sequence comes down to five connected steps: define the adherence outcome and measurement period, prepare governed data from pharmacy, clinical, claims, and patient-reported sources, validate the model for discrimination, calibration, and local population fit, connect predictions to proportionate support - whether that's a refill reminder, benefits help, clinical review, education, or human mentorship through PatientPartner - and keep measuring outcomes while watching for unintended effects and equity gaps.
AI cloud analytics should support - not replace - clinical judgment, patient choice, and human review.
FAQs
What data does AI use to predict adherence risk?
AI predicts adherence risk by pulling signals from several data sources and flagging early signs that a patient may be starting to disengage.
That can include:
- pharmacy and claims records
- scheduling data
- engagement metrics
- clinical data from EHRs, lab results, and wearables
- financial changes and patient feedback
It can also review patient communications for signs of anxiety or confusion.
How accurate are adherence risk scores in real care settings?
In real care settings, adherence risk scores can work very well when they rely on real-time data. Some models have reached 97.7% accuracy. Others predict with about 75% accuracy which patients may stop therapy within 90 days.
That said, these scores are only as good as the data behind them. Data quality matters. Regular model validation matters too. And if the score never makes it into the clinical workflow, even a strong model can sit on the shelf and do nothing.
Scores tend to be most useful when they refresh often, such as every 15 minutes. That gives care teams a near-live view of who may need help, so they can prioritize outreach early instead of reacting after a patient has already fallen off therapy.
How does PatientPartner fit into an AI-driven adherence program?
PatientPartner sits in an AI-driven adherence program as the bridge between predictive insights and human support.
When AI analytics flag patients who may be at risk - or spot early signs of non-adherence - PatientPartner helps set off timely, personalized outreach. That matters because data can spot a pattern, but it can’t always handle the human side of the conversation.
It also pairs patients with experienced mentors who share similar clinical and demographic backgrounds. AI takes care of monitoring and routine tasks, while human mentors step in when emotional support or more complex clinical concerns call for a person, not just a system.