


Cost-Efficiency Benchmarks for Mentorship Programs

Key Takeaways
Author


If I want to judge a mentorship program fast, I look at three numbers first: cost per participant, cost per outcome, and ROI. That tells me whether the program is cheap to run, whether it changes results, and whether the spend pays back in dollars.
Here’s the short version:
- Cost-efficiency asks: What does each activity or result cost?
- Cost-effectiveness asks: Does the program improve outcomes?
- ROI asks: Do the financial gains beat the total spend?
In this article, I’d focus on a small set of benchmarks that make side-by-side review easier:
- Financial: total program cost, cost per participant, cost per active match, cost per outcome
- Program flow: time to first match, first-meeting completion rate, session frequency, data collection rate
- Results: adherence, retention, satisfaction, utilization, new patient starts, persistence
A few numbers stand out right away:
- Some patient support programs showed 64.8% vs. 50.1% adherence at 12 months
- One adalimumab study showed 67.0% vs. 58.8% adherence and 14% lower discontinuation
- One example in the article uses $350,000 in costs and $1,050,000 in benefits, which equals 200% ROI and a 3.0 benefit-cost ratio
- A peer-support model estimated about $615 per participant per year in lower medical costs
If I were benchmarking one model against another, I would compare them on the same basis: cost per new patient start, cost per adherent patient, and cost per retained patient at 6 and 12 months. That makes one-to-one, group, in-person, and digital programs much easier to judge.
3 Easy Ways to Measure Success in Mentoring Programs - ROI, Participant Feedback, and More
sbb-itb-8f61039
Quick Comparison
| Area | What I’d Measure | Why It Matters |
|---|---|---|
| Spend | Total cost, cost per participant, cost per active match | Shows what the program costs to run |
| Results | Cost per patient start, cost per adherent patient, cost per retained patient | Shows what each outcome costs |
| Program flow | Match timing, first meeting rate, session count | Shows whether the program is working as planned |
| Financial return | ROI, benefit-cost ratio, net value per participant | Shows whether gains beat spend |
| Model comparison | One-to-one vs. group vs. in-person vs. digital | Shows which setup gives the best cost-to-result mix |
Put simply, I’d use benchmarks to move from “we run a mentorship program” to “here’s what it costs, here’s what it changes, and here’s whether it’s worth it.”
Core Metrics for Benchmarking Mentorship Program Cost Efficiency
To benchmark mentorship program cost efficiency, look at three layers: financial, operational, and outcome. Taken together, these give you a shared yardstick for comparing programs, vendors, and cohorts. They also make it much easier to see where a program is paying off - and where money or effort is slipping away.
Financial Benchmarks: Total Cost, Cost per Participant, and Cost per Outcome
Start with total program cost. That should cover direct costs, indirect overhead, and participant incentives.
From there, two ratios do most of the heavy lifting:
- Cost per participant per year = Total annual program cost ÷ Number of unique participants engaged
- Cost per active match = Total annual program cost ÷ Number of matches that completed at least one session
These ratios let you compare delivery models, cohorts, or vendors on the same basis.
For outcome-level benchmarking, the math changes a bit. Here, the goal is to measure incremental impact. Cost per additional patient start divides total program cost by the number of new patient starts tied to mentorship above a baseline or control group. Net monetary benefit (USD) puts a dollar value on outcomes such as avoided hospitalizations, fewer discontinuations, or higher refill rates, and then subtracts total program cost.
That’s why cost per outcome matters more than spend by itself: lower medical costs can offset higher pharmacy spend.
Once spend is clear, efficiency comes down to how fast and how steadily the program runs.
Operational Benchmarks: Match Speed, Participation, and Program Fidelity
Operational metrics help you spot trouble before lagging outcome data comes in. One of the most useful is time to first match - the number of days from enrollment to mentor assignment. Shorter match times are tied to higher engagement and lower early drop-off.
First-meeting completion rate shows whether matching and onboarding are doing their job. If many matched pairs never connect, that points to a fidelity issue, not an outcome issue.
Session frequency also matters, along with a minimum participation threshold such as at least three sessions within 90 days. That helps define whether a participant got a meaningful dose of mentorship. Track data capture monthly, too. If capture rates are low, ROI estimates get shaky.
Outcome Benchmarks: Adherence, Retention, Satisfaction, and Utilization
In U.S. healthcare mentorship, treatment adherence is the main outcome to watch. Supported cohorts keep beating controls. One 12-month study found 64.8% adherence versus 50.1% in controls - a 29.3% relative improvement and 22.0% lower discontinuation. A managed-care study of adalimumab users showed 67.0% versus 58.8% adherence, with 14% lower discontinuation and lower total healthcare costs. A broader review reported an odds ratio of 2.48 for improved adherence versus standard of care.
Those gains change the cost picture. Better outcomes bring down the effective cost per result, which is the whole point of cost-efficiency benchmarking.
| Leading Indicator | Lagging Outcome | Typical Measurement Timing |
|---|---|---|
| Time to first match | Early engagement, 90-day adherence | At enrollment, first match, 3 months |
| First-meeting completion rate | Drop-off reduction, initial treatment starts | Within 30 days of match creation |
| Session frequency (sessions/month) | 6- and 12-month adherence, patient activation scores | Monthly, then at 6 and 12 months |
| Program length | Long-term retention, repeat utilization of mentorship, chronic disease control | At program exit and annually |
| Data capture rate | Accuracy of outcome estimates, quality of ROI calculations | Continuously, audited quarterly |
Track satisfaction, utilization, and clinically relevant outcomes against baseline and control groups. For programs tied to higher-stakes procedures, such as surgery or infusion, a 10%–20% reduction in avoidable acute care episodes is a reasonable target.
Measure adherence and retention at 3, 6, and 12 months. And whenever you can, use a comparison group to check that the lift came from mentorship - not from broader market trends.
These benchmarks feed the ROI and benefit-cost calculations in the next section.
How to Measure ROI and Build a Reliable Benchmarking Framework
Once your financial, operational, and outcome benchmarks are set, the next move is to connect them in a way that finance, compliance, and commercial teams can all stand behind. That takes two things: a logic model that shows how the program creates value, and a small set of formulas that turn outcomes into dollars. Done well, this gives you a defensible way to compare mentorship models on equal terms.
Use a Logic Model to Connect Program Goals, Metrics, and Costs
A logic model lays out inputs, activities, outputs, and outcomes. Use it to connect each outcome to one KPI, one data source, and one measurement date. That keeps the plan tight and easier to audit later.
Build your measurement plan around three points: baseline, 3 months, and 6–12 months. When those checkpoints stay the same across cohorts, before-and-after comparisons are much cleaner and easier to defend.
How to Calculate ROI, Benefit-Cost Ratio, and Incremental Value
Two formulas handle most of the heavy lifting:
ROI (%) = [(Total Benefits − Total Program Costs) ÷ Total Program Costs] × 100
Benefit-Cost Ratio (BCR) = Total Benefits ÷ Total Program Costs
ROI shows your net gain as a percentage. BCR shows how many dollars you get back for each $1.00 spent. So if the BCR is 3.0, the program returns $3.00 for every $1.00 invested.
Here’s a simple example. If total benefits are $1,050,000 and total costs are $350,000, then:
- ROI = 200%
- BCR = 3.0
To turn outcomes into dollar values, use a plain approach: quantify the change, assign a unit cost, multiply. For ED visits and inpatient days, use local claims-based unit costs. You can also calculate net value at the participant level:
Net value per participant = (Total Benefits − Total Program Costs) ÷ Participants.
The table below shows one way to set this up for stakeholder reporting. Each row ties a program goal to a measured financial result.
| Goal | Outcome Metric | Data Source | Baseline | Target | Actual | Program Cost | Estimated Monetary Impact |
|---|---|---|---|---|---|---|---|
| Improve medication adherence | 12-month adherence rate | EHR / pharmacy claims | 55% | 70% | 70% | $350,000 | $1,050,000 (75 avoided admissions × $14,000) |
| Reduce ED utilization | ED visits per 100 patients | Claims data | 30 | 24 | 22 | Allocated share of total program costs | Local ED cost × change in visits |
| Increase patient satisfaction | Average satisfaction score | Patient surveys | 6.8/10 | 8.0/10 | 8.2/10 | Allocated share of total program costs | Report separately; exclude from ROI. |
One more point matters here: use conservative attribution if other interventions were running at the same time. In plain English, don't give mentorship credit for the whole improvement unless you can prove it. Assign only a portion of the observed change to the program. Then document those attribution and sensitivity assumptions in an appendix reviewed by clinical, finance, and legal leaders, especially when patient data is involved.
With ROI defined, the next step is comparing mentorship models on the same cost basis.
Comparing Mentorship Models and Setting Benchmarks for Patient Programs
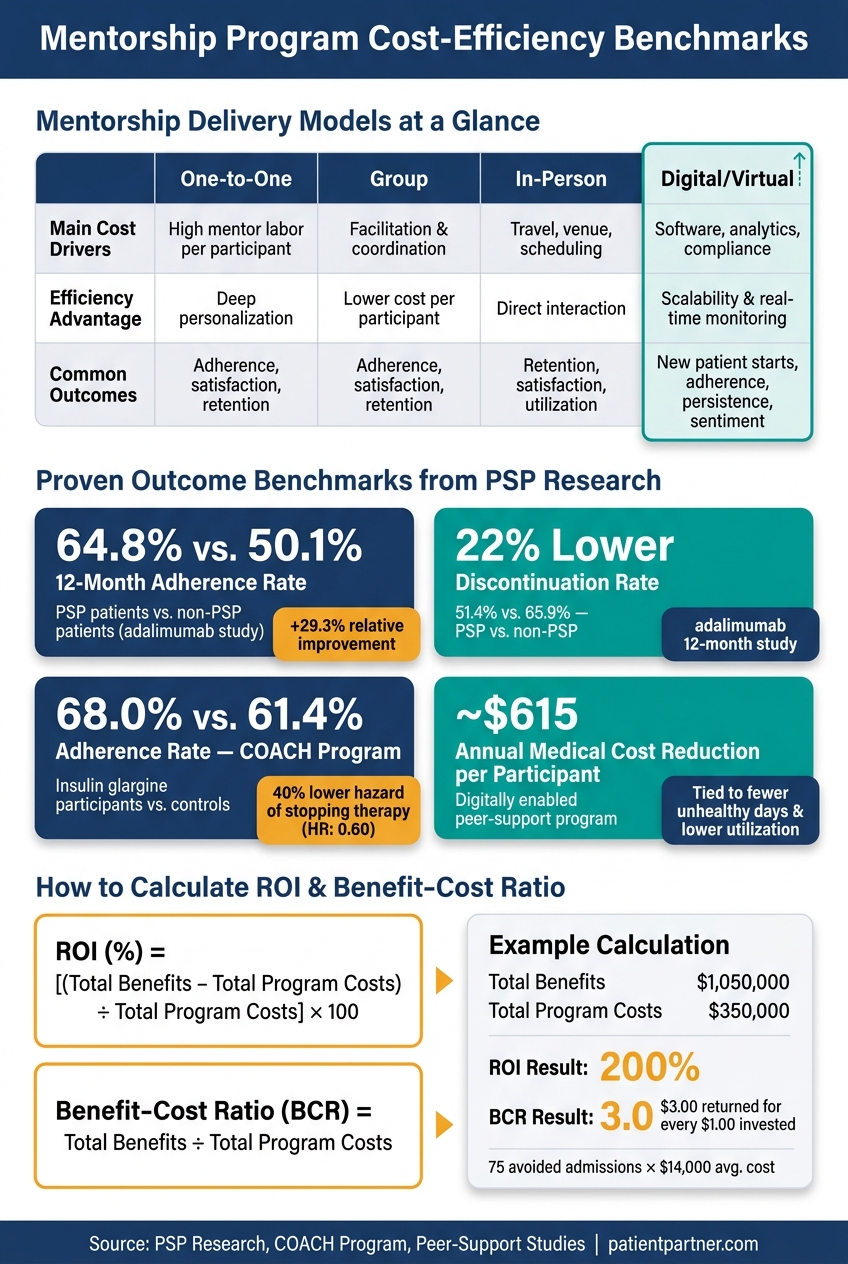
Mentorship Program Cost-Efficiency Benchmarks: Models, Metrics & ROI
With ROI and benefit-cost formulas in place, the next step is simple: compare each delivery model on the same cost base.
One-to-One, Group, In-Person, and Digital Mentorship Models Compared
If you want to benchmark mentorship formats for patient support programs, look at four things first: cost per participant, staffing intensity, scalability, and outcome consistency.
The delivery format has a big effect on cost per participant. One-to-one models usually come with higher mentor labor costs for each patient, but they also allow for deeper personalization. Group models bring down cost per participant because one facilitator or mentor can support more people at the same time. In-person formats add another layer of cost through travel, venue needs, and scheduling overhead.
Digital and virtual models cut much of that logistics spend and make real-time reporting possible across a larger program. Research comparing face-to-face and videoconference mentoring found no significant difference in mentees' perceived effectiveness across multiple mentoring domains.
Here’s how the main models compare on the cost and outcome measures that matter most.
| Model | Main Cost Drivers | Efficiency Advantage | Common Outcome Measures |
|---|---|---|---|
| One-to-one | High mentor labor per participant | Deep personalization | Adherence, satisfaction, retention |
| Group | Facilitation, coordination | Lower cost per participant; shared mentor time | Adherence, satisfaction, retention |
| In-person | Travel, venue, scheduling | Direct interaction | Retention, satisfaction, utilization |
| Digital/virtual | Software, analytics, compliance | Scalability, real-time monitoring, lower logistics | New patient starts, adherence, persistence, sentiment |
Those model differences show up fast in program economics, especially when teams are judged on starts, adherence, and retention.
Benchmarks for Patient Mentorship Programs in U.S. Healthcare
For pharmaceutical and med-tech programs, the cleanest way to compare models is by looking at cost per new patient start, cost per adherent patient, and cost per retained patient at 6 and 12 months.
PSP research gives a useful range for those benchmarks. One study of a PSP for adalimumab found 29.3% higher adherence (64.8% vs. 50.1%) and 22% lower discontinuation (51.4% vs. 65.9%) over 12 months compared with non-PSP patients. The COACH program for insulin glargine found that participants were more likely to be adherent (68.0% vs. 61.4%) and persistent (48.5% vs. 42.1%). It also reported a discontinuation hazard ratio of 0.60, which means a 40% lower hazard of stopping therapy.
Cost matters too, of course. A digitally enabled peer-support program estimated annual medical cost reductions of about $615 per participant by tying psychosocial support to fewer unhealthy days and lower utilization.
That means a program can still make a strong ROI case even if it costs more per patient than other options, as long as it delivers adherence lifts in the 15% to 28% range and shows measurable drops in hospital or ED visits.
Where PatientPartner Fits in a Cost-Efficiency Benchmark Model
For teams using digital mentorship, the benchmark question shifts from which format is cheaper? to which platform improves cost per start, adherence, and retention most effectively?
PatientPartner fits the digital/virtual model, so it can be measured against the same cost-per-outcome benchmarks. Its matching algorithm connects prospective patients with experienced mentors who have gone through similar healthcare journeys, which may improve cost-per-outcome by making matches more relevant.
Organizations using the platform have reported a 30% increase in treatment adoption rates and a 20% improvement in treatment adherence. Those numbers sit within the adherence-lift range reported in PSP research. PatientPartner’s dashboards also let teams track new patient starts, persistence, sentiment, and engagement against program cost in real time.
Conclusion: The Benchmarks That Matter Most
Once your measurement framework is set, the next move is picking the benchmarks that matter most. Cost-efficiency is straightforward: a program should deliver the target outcome at the lowest sustainable cost per outcome, measured against a clear baseline.
The main benchmarks fall into three groups: financial, operational, and outcome-based.
ROI and benefit-cost ratio turn program performance into financial terms leaders can size up fast. They help teams make decisions, but they shouldn't be treated as goals on their own.
Delivery format matters too, because it changes the cost structure. That means your benchmarks need to line up with how the program is delivered. Even so, every format should still be judged on the same core measures:
- Cost per outcome
- Participation
- Retention
For U.S. patient programs, the benchmarks that matter most are new patient starts, adherence, persistence, satisfaction, and relevant clinical utilization. These are the measures that turn mentorship spend into a business case leaders can defend.
FAQs
How do I calculate cost per outcome?
Divide total program costs by the number of successful outcomes. Count direct expenses like platform licensing fees, staff training, and team time.
Then define outcomes in a way you can measure. That might mean patients retained, treatment adoptions, or fewer readmissions.
Here’s the math in plain English: if a program costs $50,000 and leads to 500 long-term adherence outcomes, the cost comes to $100 per patient.
It also helps to track results at key checkpoints:
- 30 days
- 90 days
- 6 months
- 1 year
That way, you can see how efficiency changes over time instead of relying on a single snapshot.
What data do I need to measure ROI?
To measure ROI for a mentorship program, compare the program’s total costs with its financial and clinical gains.
Start with the cost side. Add up expenses like staff training, platform fees, and any marketing or outreach spend.
Then look at the return. Track metrics like adherence and retention at 30 days, 90 days, 6 months, and 1 year. Also track care outcomes, such as fewer readmissions or better health markers.
From there, put dollar amounts on those gains. You can use patient lifetime value, average monthly revenue per patient, and cost avoidance tied to fewer drop-offs.
How can I compare mentorship models fairly?
Compare mentorship models with the same scorecard for efficiency and long-term impact. That way, you're not comparing apples to oranges.
Use a shared set of metrics across each model, including:
- participation rate
- satisfaction scores
- patient outcomes, such as treatment adherence
- retention rates
- ROI
- administrative burden
- scalability
- data consistency
Cost should be part of the same review. Track platform fees, staff training, and any setup or support costs, then weigh them against gains like better adherence and fewer readmissions.
It also helps to check performance at fixed points so trends are easier to spot. A simple cadence is 30, 90, and 180 days. Those checkpoints can show whether a model gets early traction, holds attention over time, and leads to better patient and program results.