


Tracking Chronic Disease Outcomes with Real-Time Data
Key Takeaways
Author


Real-time patient data can help care teams act sooner, but it does not prove better health on its own. From what I see in the article, the clearest pattern is this: engagement signals like app use, device syncing, and survey completion can flag short-term adherence risk, while clinical outcomes like HbA1c, blood pressure, ER visits, and hospitalizations show whether care is actually working.
Here’s the short version:
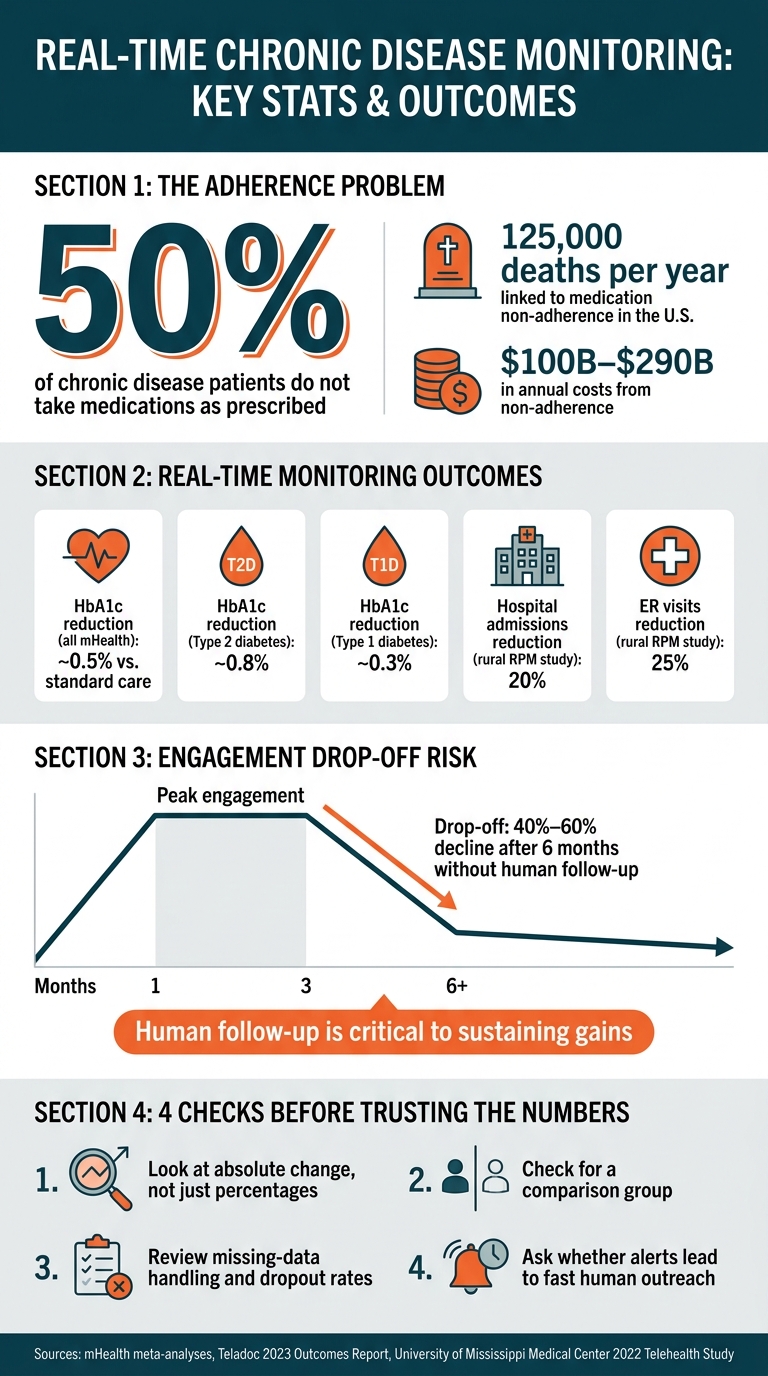
- About 50% of people with chronic disease do not take medications as prescribed.
- Medication non-adherence is tied to 125,000 deaths per year in the U.S. and $100 billion to $290 billion in annual costs.
- Real-time programs often show the clearest gains in diabetes, with average HbA1c drops around 0.5%, and about 0.8% in some Type 2 diabetes studies.
- Engagement often drops after the first few months, with some programs seeing a 40% to 60% decline after 6 months if no person follows up.
- Results on ER visits and hospital use are mixed because some programs prevent problems, while others spot issues earlier and lead to more care.
What matters most is simple:
- Engagement is a leading signal
- Adherence connects engagement to outcomes
- Human follow-up often decides whether early alerts lead to action
- Study design matters before you trust the numbers
A few data sources show up again and again in the article: connected glucose meters, blood pressure cuffs, inhaler sensors, smart scales, ePROs, pharmacy claims, and EHR data. Each tells a different part of the story. A synced device may show participation. A refill gap may show missed treatment. A lab value shows whether health is changing.
| Signal type | What it shows | Main limit |
|---|---|---|
| Engagement data | Whether a patient is participating | Does not equal better health |
| Adherence data | Whether treatment is being followed | May still miss reasons for drop-off |
| Clinical outcome data | Whether care is improving health | Often comes later |
If I were sizing up a program, I’d focus on four checks first:
- Look at absolute change, not just percentages.
- Check for a comparison group.
- Review missing-data handling and dropout rates.
- Ask whether alerts lead to fast human outreach.
Bottom line: real-time tracking works best when it sits inside a clear care path - signal, escalation, person-to-person follow-up, and outcome tracking. Without that chain, dashboards can look busy while patient results stay flat.
Real-Time Chronic Disease Monitoring: Key Stats & Outcomes
Wearables, remote patient monitoring & the future of chronic care management with Richard Milani, MD
sbb-itb-8f61039
What Recent Studies Measure and How They Measure It
Study design makes all the difference. A real-time signal can point to a meaningful clinical shift, or it can just add more noise. So before looking at results, it helps to look at the inputs: what data these studies track, and how the studies are built.
Common Real-Time Data Sources
Recent studies pull from a few common data sources. Each one tracks a different kind of signal, and some matter more than others depending on the care decision in front of you.
Connected medical devices are the most direct way to monitor physiology. Bluetooth-enabled glucose meters, smart blood pressure cuffs, and connected scales collect readings that clinicians can actually use. A glucose meter tracks blood sugar and Time in Range (TIR), which matters for diabetes care and insulin dosing. A smart BP cuff records systolic and diastolic pressure over time instead of relying on one reading in a clinic. That kind of steady measurement matters when treatment changes depend on frequent, accurate numbers.
Wearables such as smartwatches and continuous patches add a different signal. They track heart rate, activity, sleep, and oxygen saturation. That makes them more useful for lifestyle and behavior tracking than for medication dose changes or urgent care decisions.
Electronic patient-reported outcomes (ePROs) collect symptom logs and app-based surveys. They show how a patient feels day to day, including pain, fatigue, or medication side effects. That can be very helpful, but it is still subjective and depends on the patient logging data on a steady basis.
Pharmacy and claims data show refill behavior. EHRs connect those patterns to endpoints like HbA1c, ER visits, and hospitalizations.
| Data Source | Primary Metrics | Clinical Relevance |
|---|---|---|
| Connected Glucometer | Blood glucose, Time in Range (TIR) | Diabetes management & insulin dosing |
| Smart BP Cuff | Systolic/Diastolic pressure | Hypertension control & stroke prevention |
| Inhaler Sensors | Rescue vs. controller medication use | Asthma/COPD exacerbation prediction |
| Smart Scales | Body weight, fluid retention | Heart failure monitoring |
| Pharmacy/Claims Data | Refill gaps, PDC/MPR | Medication adherence verification |
| EHRs | HbA1c, ER visits, hospitalizations | Long-term clinical outcomes |
Study Designs Behind the Evidence
Once you know what signal is being tracked, the next question is simple: how much weight should you give the result?
Randomized controlled trials (RCTs) give the strongest evidence for cause and effect because they control for confounding factors. A cluster-RCT of WellDoc BlueStar across 11 primary care practices found a larger HbA1c reduction with real-time mobile glucose feedback than with control.
Pragmatic clinical trials (PCTs) are getting more attention in U.S. healthcare because they test performance in normal care settings, with normal workflows and patient groups. They give up some control, but they tell you more about whether a program will work outside a tightly managed research setting.
Observational and retrospective studies can show long-term utilization patterns across large, non-randomized cohorts. What they can't do on their own is prove causation. Systematic reviews and meta-analyses pull together findings from many studies, which gives a broader read on the evidence base, though the output still depends on the quality of the studies going in.
That helps explain why two tools that look similar on the surface can lead to very different outcome signals. A useful way to read any study is through PICO:
- Population: who was studied
- Intervention: what real-time tool or program was used
- Comparator: standard care vs. digital intervention
- Outcome: what clinical endpoint was measured
If a study has no clear comparator, or only reports results from active users, it deserves a more careful read.
What the Evidence Says About Adherence, Outcomes, and Utilization
Once you look at the study designs, the next step is simple: which outcomes actually change?
engagement and adherence findings
Real-time monitoring often helps with short-term adherence. But that lift usually fades when there isn't any human follow-up behind it. In practice, login frequency and sensor syncing are the clearest signs of who is likely to stay on track in the near term.
The bigger issue is sustained engagement. Use of real-time tools tends to peak in the first three months and then fall off. Studies show engagement can drop by 40% to 60% after the six-month mark when programs don't include human follow-through. That drop isn't a side note. It has a direct effect on whether early adherence gains stick.
Clinical Results and Healthcare Utilization
Glycemic control shows the clearest pattern. Across mHealth studies, real-time interventions are tied to a mean HbA1c reduction of about 0.5% compared with standard care. The effect is stronger in Type 2 diabetes, where studies show an average reduction of 0.8%, compared with 0.3% in Type 1 diabetes.
Teladoc Health's 2023 clinical outcomes report gives a concrete example. Its 2023 outcomes report found a 0.8% HbA1c drop over 12 months along with lower diabetes-related costs.
Results on healthcare use are more mixed. The University of Mississippi Medical Center's 2022 telehealth impact study found that remote patient monitoring for diabetes and hypertension cut hospital admissions by 20% and ER visits by 25% among rural participants. But the broader research doesn't point in just one direction. Some programs reduce visits by catching problems early. Others increase visits because they bring hidden issues to light.
Comparison of Recent Study Findings
Across studies, physiologic markers respond most reliably, especially HbA1c and systolic blood pressure. Quality-of-life measures and long-term outcomes are less steady, mostly because many participants drop out before studies end. Utilization metrics can move either way depending on what the program is doing: preventing problems or surfacing them sooner. So the signal matters, but it doesn't explain itself.
How to Interpret Real-Time Data Responsibly
Real-time monitoring can spit out impressive numbers. But a data point matters only if it's reliable, clinically interpretable, and tied to an action. The main question isn't whether data gets collected. It's whether that data predicts a meaningful clinical change in patient outcomes.
Limits in the Current Evidence Base
The main issue usually isn't the signal itself. It's whether the study design can support the claim.
Selection bias shows up a lot. People in digital health studies are often more tech-savvy, more motivated, and more health-literate than the average chronic disease patient in the U.S. That gap matters when a team wants to scale a program to a broader population.
Access gaps can make that problem worse. Many studies give participants free devices and tech support. On paper, that can make results look stronger than what happens in routine care, where barriers are harder to ignore and attrition and missing data tend to climb.
There's also the issue of inconsistent definitions. One study may define engagement one way, while another uses a different standard. That makes benchmarking shaky. More data doesn't automatically mean better outcomes.
Then there's short follow-up. A lot of studies stop before six months, so it's hard to tell whether results last.
Those weak spots matter because they change how much weight U.S. teams should put on the findings.
Evidence Standards for U.S. Decision-Makers
When you're reviewing a study or sizing up outcomes data, four checks help separate signal from noise.
- Prioritize absolute effects over relative ones. A "50% improvement" may sound huge, but it can still reflect a small and clinically trivial shift in the actual metric. Ask for the hard numbers: the reduction in mmHg, the HbA1c change in percentage points, or the shift in hospital readmissions or ER visits.
- Pair those with confidence intervals. That gives you a better sense of the range of likely results in practice.
- Check how missing data is handled. Methods like multiple imputation or last observation carried forward can change how successful a real-time monitoring program appears. If attrition or missing data isn't addressed directly, treat the results with caution.
- Without a comparator, effect attribution is weak.
On the compliance side, HIPAA-aligned workflows are the baseline. Any real-time data program in the U.S. needs to encrypt data both at rest and in transit. Patient consent also needs to clearly cover automated alerts and any third-party monitoring, especially as data moves from a home device into the EHR.
Use these checks before deciding which real-time signals deserve human follow-through. They lead straight into the next step: turning alerts into human follow-through.
Applying the Findings to Patient Engagement Programs
From Alerts to Human Follow-Through
The findings point to a clear next move: turn real-time signals into action, and do it fast.
Automated monitoring can show when a patient is having trouble. It usually can't show why. That gap matters. Two high-risk windows stand out: the first 48–72 hours after a prescription begins, and the 30–90 day period, when drop-off tends to happen. Automated reminders can help at first, but they often lose steam without a person stepping in.
That makes sense if you think about it. A reminder may help someone who simply forgot. But it won't do much for a patient dealing with side effects, cost, low confidence, or distress. Those are the problems that often shape adherence, persistence, and avoidable utilization.
A simple escalation path can help keep things on track. For example:
- Send an automated alert after a first missed reading
- Trigger personal outreach from a mentor or nurse after repeated misses
That setup keeps the workflow manageable while making sure the highest-risk patients get direct contact at the moment it matters most.
Where PatientPartner Fits
This is where a mentor-led workflow can close the gap between an alert and actual follow-through.
PatientPartner uses engagement signals to trigger mentor outreach, helping teams surface the barriers behind missed doses and missed readings. It also helps pharma and med-tech teams track time to treatment initiation, monitoring completion rates, medication persistence, and discontinuation trends.
In plain terms, the platform supports both new starts and long-term persistence in ways that monitoring by itself often misses.
Conclusion: Real-Time Tracking Works Best as Part of a Care Pathway
Taken together, the evidence points to one practical rule: engagement metrics and health outcomes are not the same thing. The strongest programs connect four parts of the process - real-time signals, escalation, human support, and outcomes - instead of relying on just one piece.
FAQs
How is engagement different from outcomes?
Engagement is a patient’s day-to-day participation in care. That can include app logins, replies to messages, refill history, and interactions with a mentor.
Outcomes are the measurable results of that care. Examples include HbA1c levels, adherence rates, and fewer hospitalizations.
Put simply, engagement shows how involved a patient is over time, while outcomes show the health goals that involvement helps achieve.
Why do real-time programs lose engagement over time?
Real-time programs often lose steam because day-to-day care is hard. Patients deal with confusion, fatigue, and small hassles that add up fast. Treatment burnout, fear of side effects, and anxiety can make it even tougher to stay engaged.
Alerts can also backfire. If patients get too many notifications - or ones that don't feel useful - they may start ignoring them altogether. And once the newness fades, automated systems on their own may fall short. They can't always give people the empathy and personal support that help them stick with care over time.
What should I check before trusting study results?
Check whether the research was clinically tested and shown to work. That sounds basic, but it matters. A study can look polished on paper and still rest on weak evidence.
It also helps to look at the study design with a bit of healthy doubt. A small sample size or a short trial period can limit how far you can take the findings. If only a small group was studied, or the test ended too soon, the results may not hold up across a broader patient group.
You’ll also want to see whether the study included a diverse patient population. If the participants all came from a narrow group, the findings may not apply as well to everyone else.
And pay close attention to how the data was collected. Studies that use objective, real-time data are usually more dependable than studies built on backward-looking methods like self-reports or pill counts. Why? Because those older methods can be shaped by manipulation or recall bias. In plain English: people may forget, guess, or report what they think the researcher wants to hear.